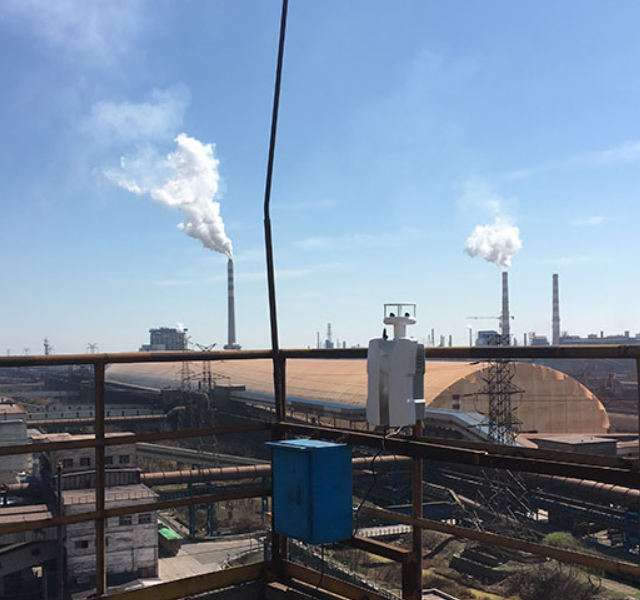
Set up several monitoring points based on the layout of the industrial park and the distribution of pollution sources. Arrange monitoring points in key areas such as the factory entrance, production workshop surroundings, and discharge outlets to ensure the representativeness and accuracy of monitoring data.
Real time analysis of collected CO and NO concentration data, drawing concentration change curves, and timely warning of abnormalities. Regularly generate monitoring reports to provide air quality status and pollution control suggestions for enterprises. At the same time, compare the monitoring data with national standards to evaluate the air quality status of industrial parks.
- Overview
Application case 1:
CO tracing case in an industrial park in Shandong province
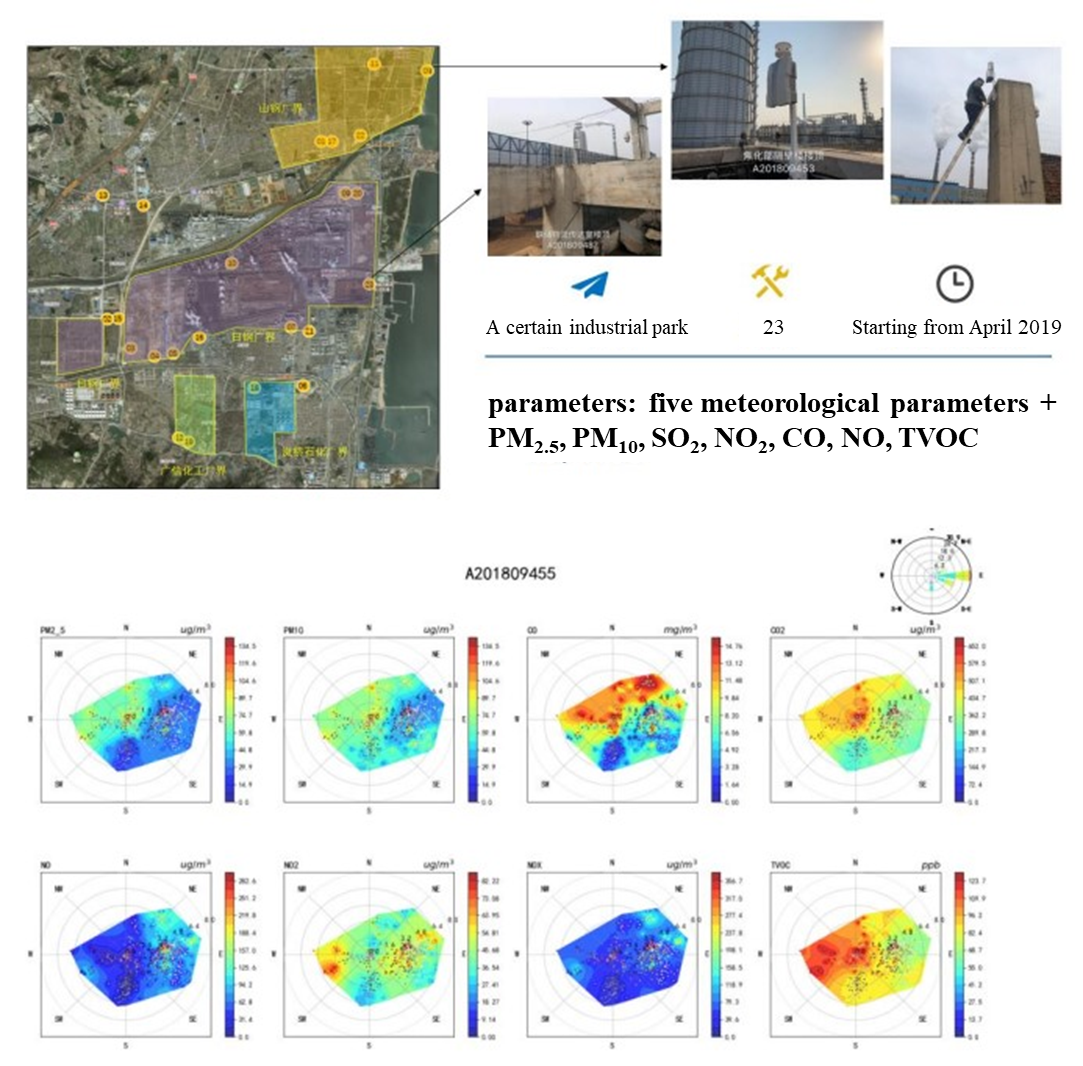
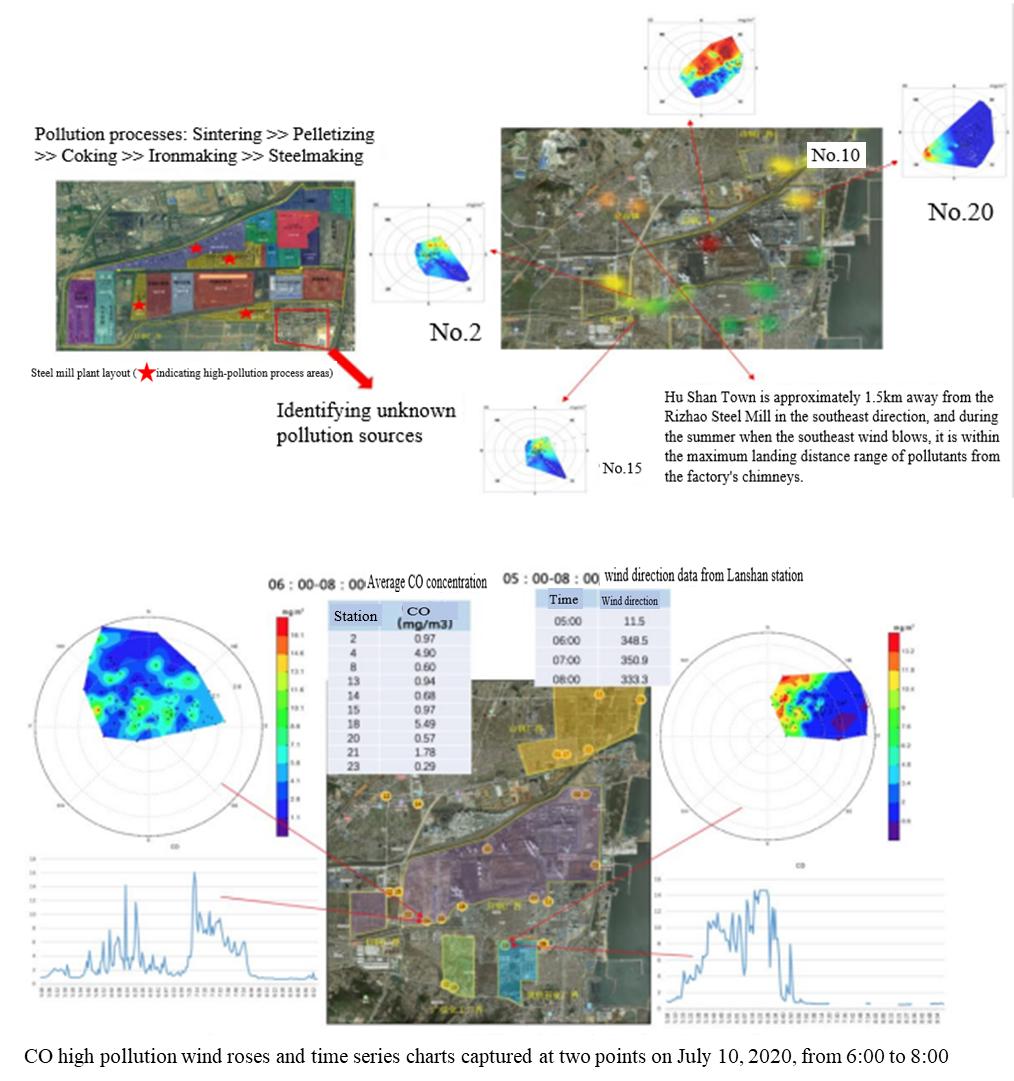
Case Description:
By utilizing pollution source tracing wind rose diagrams, we can locate unknown pollution sources and accurately pinpoint fugitive emissions within the industrial park.
Application case 2:
A Comprehensive Case Study on Tracing the Origins of CO, NOx, SO2, TVOC, and PM in an Industrial Park Along the Yangtze River
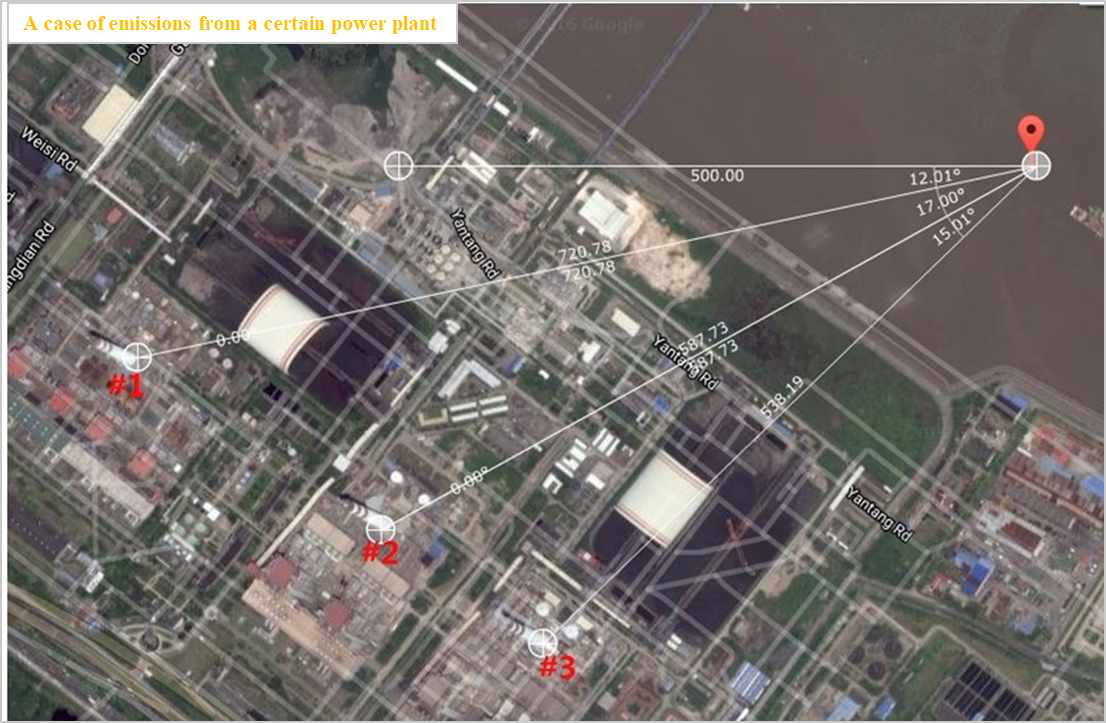
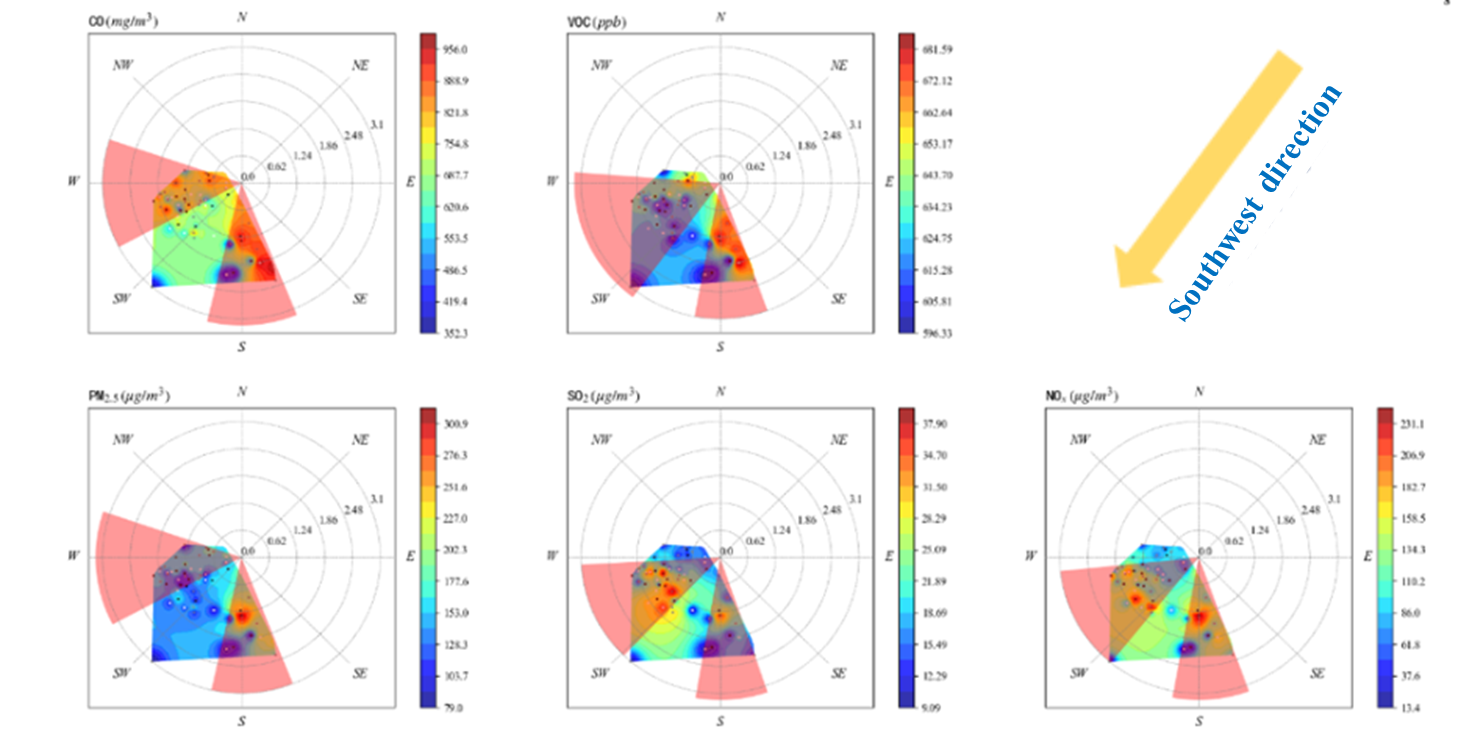
The monitoring equipment is located on an observation vessel at the Yangtze River's estuary. The wind rose diagram of pollutant concentrations indicates that when the wind direction is southwest, the concentrations of NOx and SO2 significantly increase, while other pollutants, including TVOC, CO, and PM, show no notable changes. Considering this emission characteristic along with satellite maps, we conclude that the emissions originate from a coal-fired power plant somewhere in Shanghai: The high-temperature combustion at this coal-fired power plant generates substantial amounts of NOx and SO2, but TVOCs and CO are efficiently converted to CO2 during the high-temperature process, and its dust removal devices successfully remove the vast majority of particulate matter.
When the wind direction changes, monitoring data reveal another emission source located 10 degrees south-by-east of the equipment. Unlike the coal-fired power plant, this source emits TVOC, CO, NOx, SO2, and PM simultaneously. Again, with the help of satellite map identification, we discover that this location houses a newly constructed sludge incineration plant (completed around July of that year), specifically designed for incinerating and disposing of the bottom sludge produced by a sewage treatment plant. This discovery underscores the high flexibility of micro-stations in their placement and their crucial role in detecting and locating unknown pollution sources. It also highlights the necessity for the aforementioned incineration facility to further enhance particulate matter filtration and emission control for TVOCs and other pollutants.
